CSV Visualizer
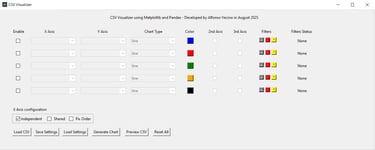
This is a Windows-based application in Python for interactive visualization of CSV data using matplotlib. The user interface was built with tkinter, while pandas data frames were used to efficiently read, manage, and manipulate the input data. The application allows users to configure up to five different curves by selecting custom x- and y-axis values, with each curve supporting up to five filters for refined analysis. To ensure robustness, I implemented input validation to guarantee filters were applied correctly, and I added the capability to save and reload user configurations via JSON files, enabling a seamless workflow for repeated analyses.

6,200
Lines of code
Screenshots
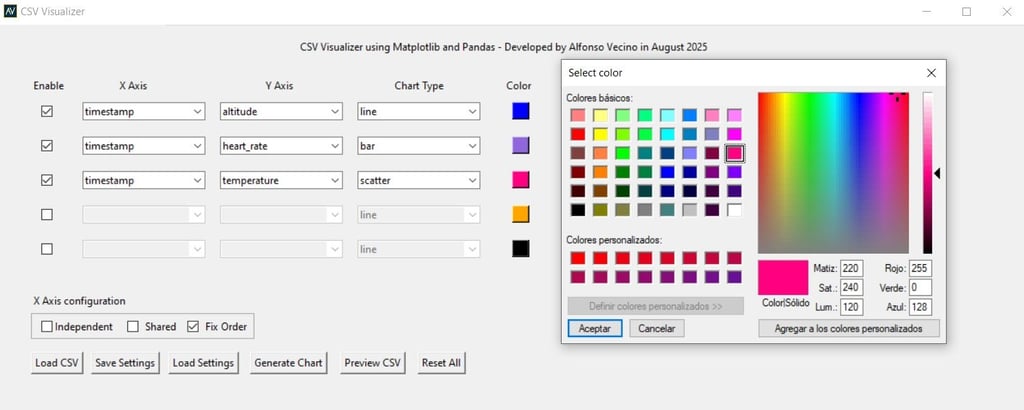
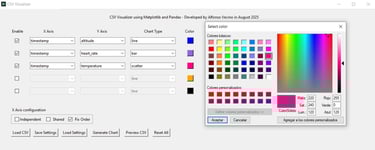
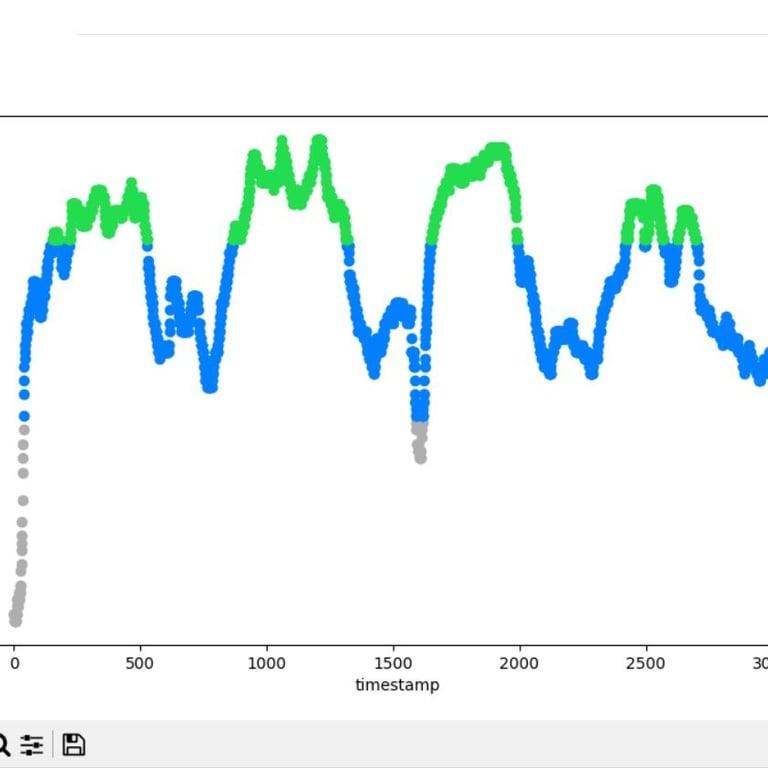
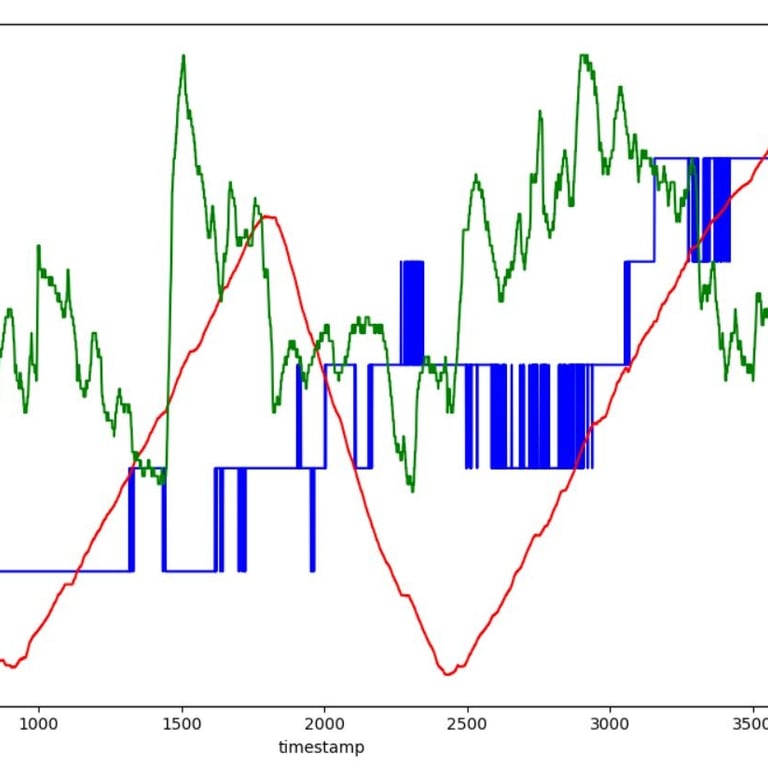
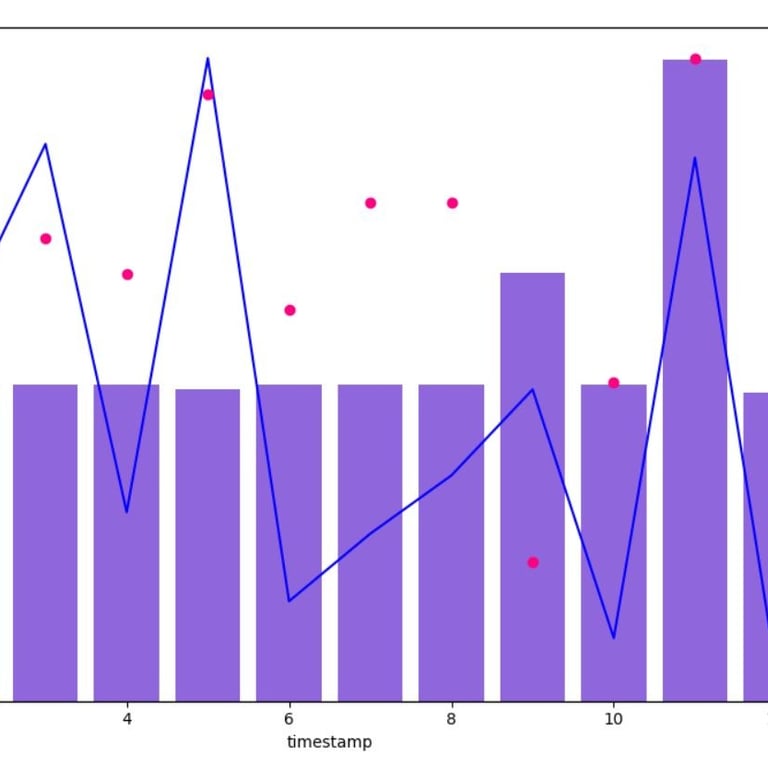
Color customization for each curve on the graph.
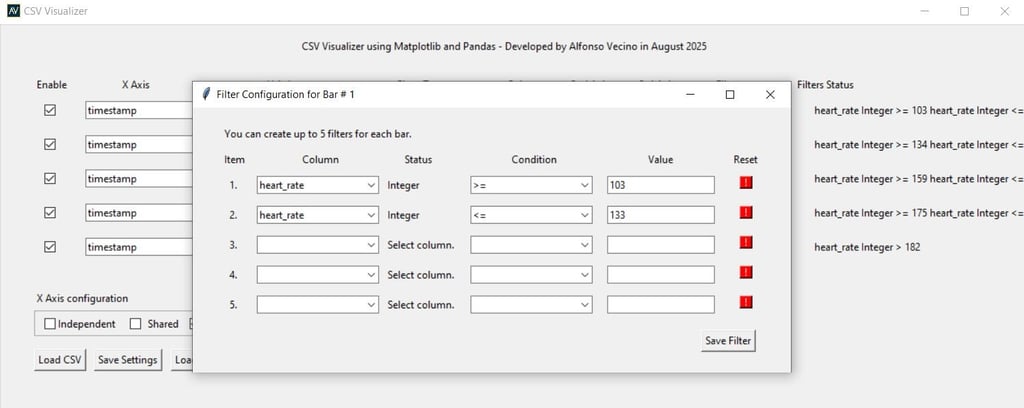
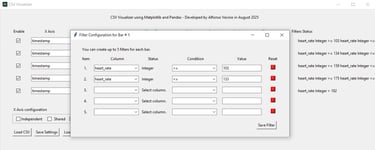
Add, edit or remove up to 5 different filters for each curve.
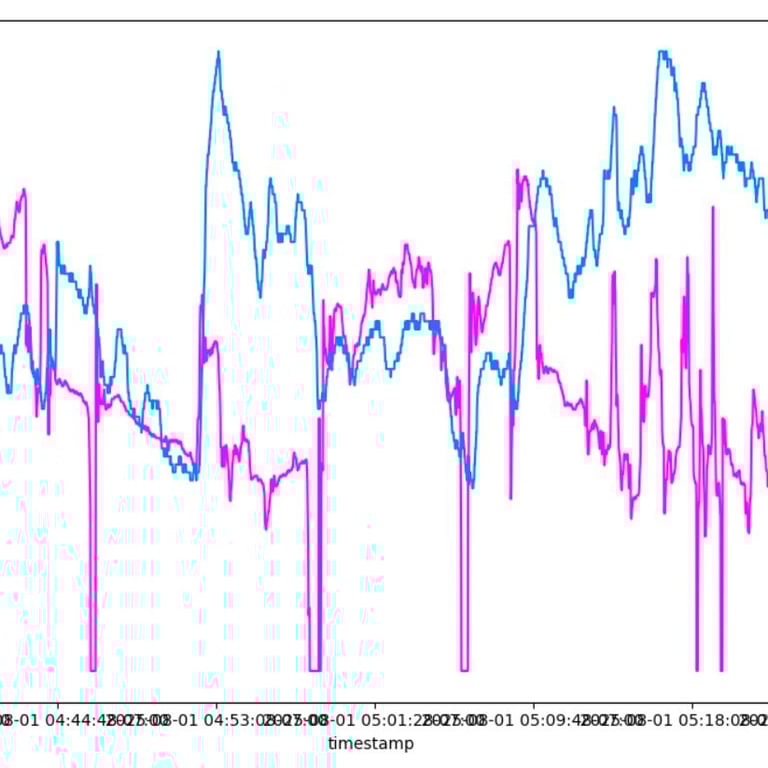
Example of some graphs generated.
Download
Windows Application: Download
Overview
Release date: September 4, 2025
Source code - GitHub: https://github.com/alfonsovecino/CSV-Visualizer
Contact
My social media.
© 2025. All rights reserved. - Developed by Alfonso Vecino. alfonso_uis@hotmail.com